Today's wind trend
Last fall I wrote a program to take wind data collected from our house and plot it as a function of frequency and power. The graph is called a Wind Rose and it is used for planning wind power generator sites. The chart nicely illustrates the direction with the most wind power potential, which might not be the same as where the wind blows from the most.
How to read the chart:
- The direction compass is split into twelve slices, N, NNE, ENE, E and so on.
- The background triangle (blue) in a slice depicts how often the wind blows from that direction.
- The next layer up (gray) combines frequency with speed to shows how much this slice contributes to the overall average wind speed.
- The final, top layer of the slice (red) uses the cube of wind speed and frequency to show how much power comes from that direction.
Since weather patterns change with the seasons I thought it would be interesting to graph each month's Wind Rose since last December.
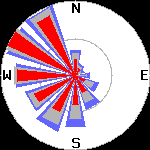 December |
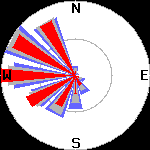 January |
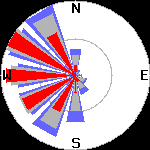 February |
|---|---|---|
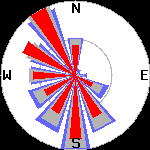 March |
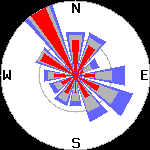 April |
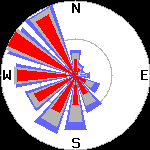 All five months |